
Zone 2 is easy aerobic riding for building endurance, at a pace where you can still speak in full sentences. In Coggan’s power system it equals 56 to 75% of your FTP. Heart-rate zones differ by app and formula, so the same bpm can land in different zones on two devices. If your riding time is limited and faster performance is your main goal, ride easy part of the time and add harder work.
What Zone 2 means and why the number changes
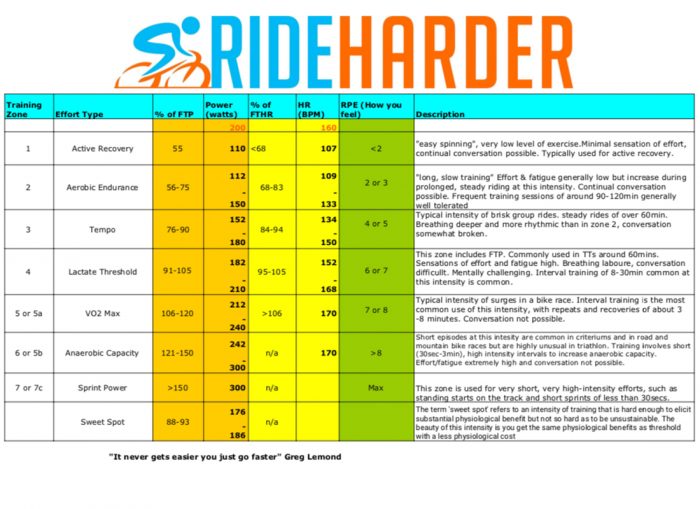
Zone 2 means easy aerobic endurance riding. The confusion starts because two training systems attach different numbers to the same name.
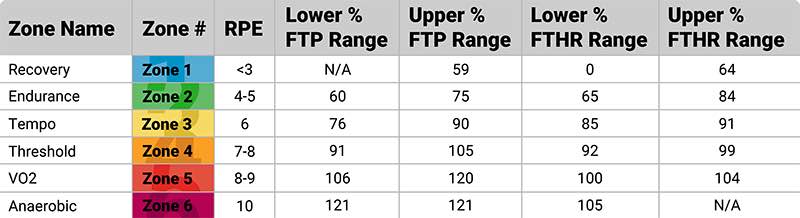
In Andrew Coggan’s seven-level cycling power system, Level 2 Endurance covers 56 to 75% of functional threshold power (FTP). FTP is an estimate of the power you can sustain on a bike, and it sets your workout intensities. Level 1 Active Recovery sits below 55% of FTP, and Level 3 Tempo covers 76 to 90%.
Exercise physiologists also describe Zone 2 in relation to the first lactate threshold (LT1) or first ventilatory threshold (VT1). Both mark the point where your body’s response changes as effort rises: blood lactate starts to climb at LT1, and breathing starts to speed up at VT1. A 2025 expert viewpoint from 14 scientists and coaches favored defining physiological Zone 2 as riding immediately below LT1 or VT1.
Your own measured LT1 can sit at a different point than Coggan’s FTP-based band, so a boundary on your screen is not necessarily your physiological limit.
A Zone 2 number comes from one of three sources: cycling power relative to FTP, a heart-rate calculation, or an individually assessed physiological threshold.
Find an easy endurance effort without a power meter
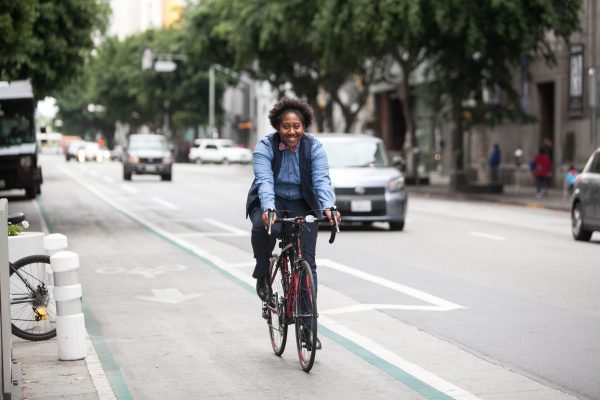
Without a power meter, you can find an easy pace by listening to your breathing and noting how steadily you can hold it.
The CDC describes moderate-intensity activity as effort that lets you talk but makes singing hard. At vigorous intensity, you can’t say more than a few words without pausing for breath. That gives you a rough effort check for easy riding. Measuring LT1 exactly takes a separate threshold test.
In a 2004 study of 16 healthy volunteers, Persinger and colleagues found that speech became difficult at about ventilatory-threshold intensity, on both a treadmill and a stationary bike (cycle ergometer).
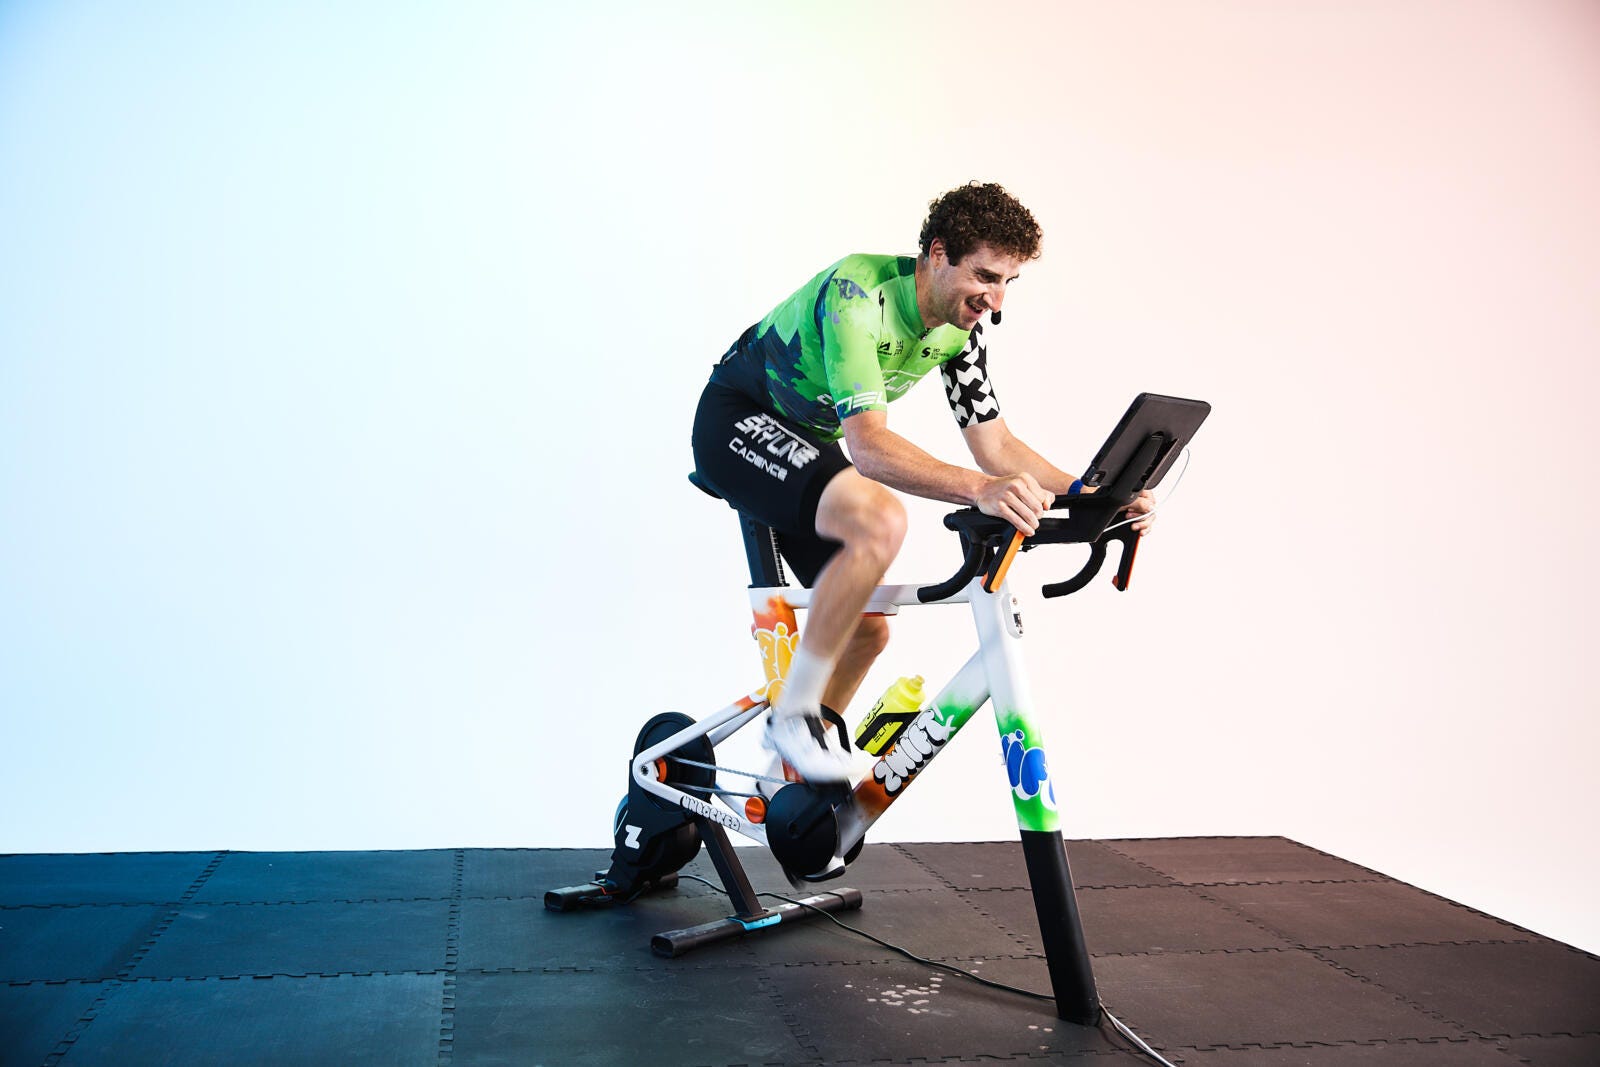
On a safe, steady stretch of road, say a full sentence out loud at your normal speaking pace. If you keep breaking it up to breathe, ease off until the words come easily. You should be able to hold that effort without constant strain.
Make sense of Zone 2 on your watch or power meter
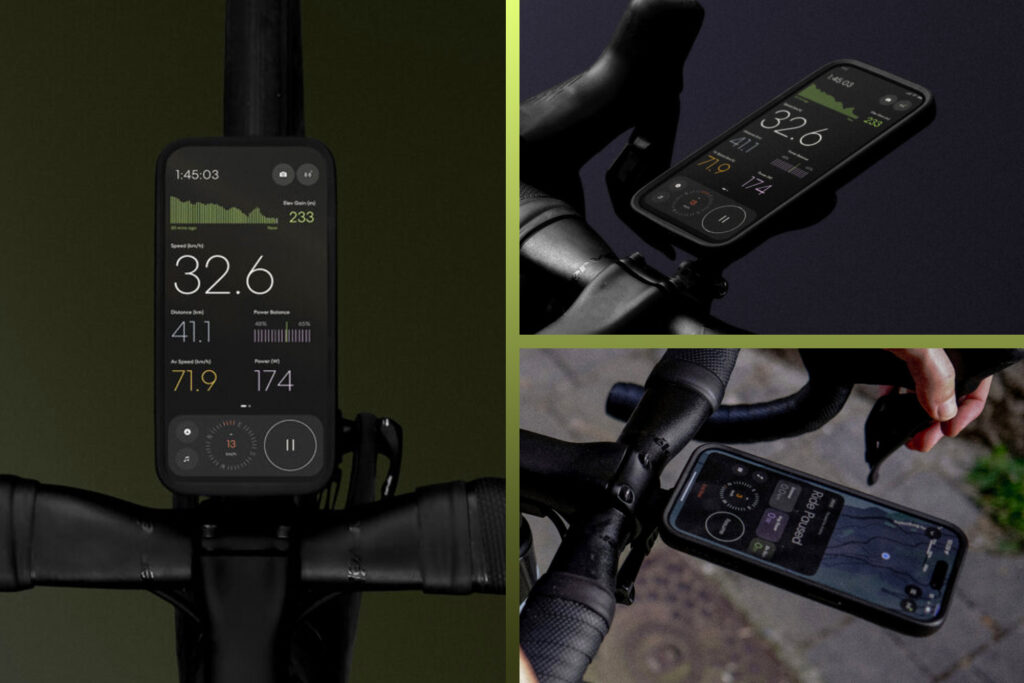
Devices disagree about Zone 2 because some measure watts, others measure beats per minute, and each calculates from its own reference value.
Power zones are based on your cycling FTP. Heart-rate zones can use maximum heart rate, threshold heart rate, resting heart rate, or a mix. TrainingPeaks documents several methods, so the model your app uses matters as much as the number it shows.
| Method | Reference | What it helps with | Limit |
|---|---|---|---|
| Talk test and perceived effort | Speech and sustainable effort | Riding without sensors | Rough intensity cue |
| Coggan power Zone 2 | 56 to 75% cycling FTP | Watts-based endurance target | Depends on a good FTP estimate |
| Heart-rate zones | Selected HR model and input | Tracking HR within one system | Methods give different boundaries |
| LT1 or VT1 | Individually assessed thresholds | Physiological intensity reference | Needs a threshold test |
Your watt targets come from your FTP. With an FTP of 150 watts, Coggan’s Level 2 range works out to 84 to 112.5 watts (150 × 0.56 to 150 × 0.75). TrainerRoad defines its own endurance range as roughly 55 to 75% of FTP.
Zone 2 gets confusing fast once you compare apps. One rider who checked Garmin, Strava, ROUVY, Apple, and Wahoo found the ranges differed so much that Zone 2 stopped seeming clear.
The rider listed these Zone 2 bands, though the settings behind them were unknown:
- Garmin: 106 to 123 bpm
- Strava: 105 to 138 bpm
- ROUVY: 114 to 123 bpm
- Apple: 130 to 141 bpm
- Wahoo: 112 to 138 bpm
Open the cycling-zone settings on one device and note the metric, the calculator, and the FTP or heart-rate threshold it uses. Then do the same on the next device before you compare.
When Zone 2 is worth your limited riding time
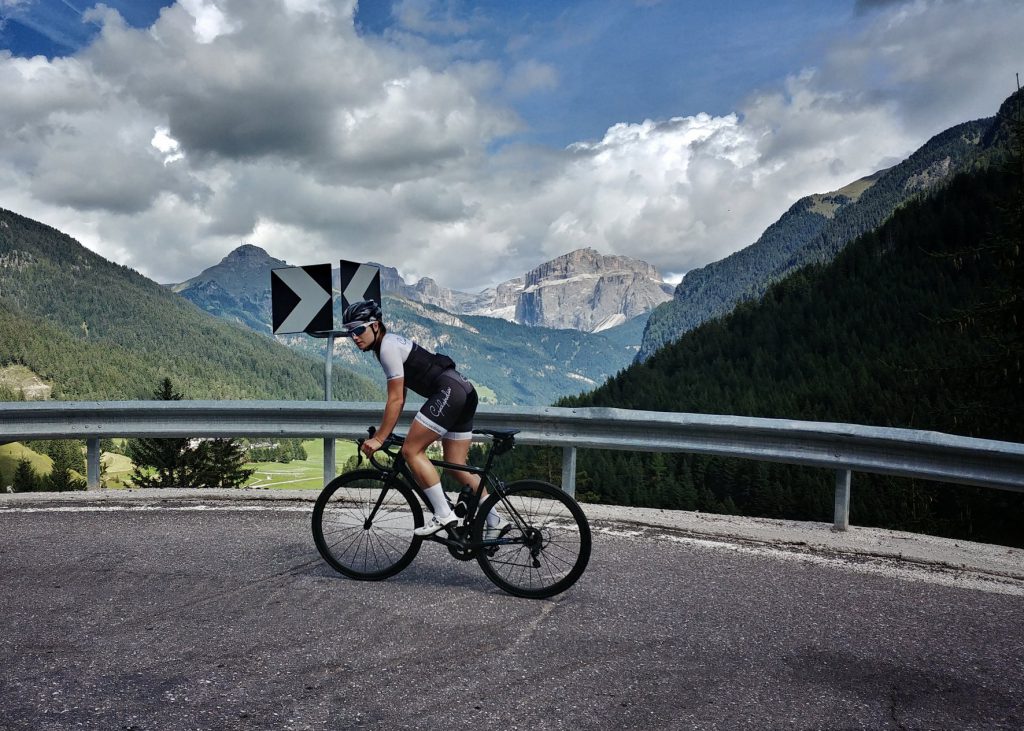
Zone 2 makes sense when you want to ride farther or spend more time on the bike comfortably. When faster performance is your priority and your hours are scarce, easy rides share the week with harder work.
A 2025 review in Sports Medicine challenged the claim that Zone 2 is uniquely optimal for mitochondrial and fat-oxidation adaptations, particularly at lower training volumes. Higher-intensity work also contributes to aerobic development.
A separate 2025 pooled analysis of 13 studies and 348 endurance athletes found no significant overall advantage for polarized training (mostly easy riding plus some very hard sessions, with little in between) over other ways of distributing intensity.
| Your main goal | Role of an easy ride | Trade-off |
|---|---|---|
| Longer, comfortable recreational outings | Build repeatable endurance time | Long rides still take time and recovery |
| Faster performance with limited weekly hours | Keep an aerobic component | Some of your time is better spent on harder efforts |
| Structured competitive endurance training | Part of a broader distribution of intensities | Training status and the larger program affect the balance |
Take two riders with five to six hours a week: one wants a comfortable longer weekend ride and builds easy endurance time, the other wants speed and keeps an easy ride while giving part of the week to harder work.
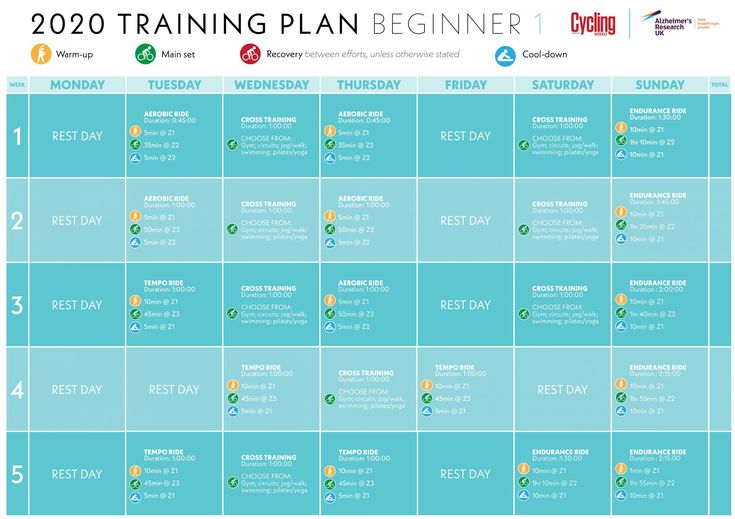
A universal rule that every recreational rider should spend 80% of training time in Zone 2 has no support. Set the role of your easy ride by your main goal, the hours you can ride, and the recovery your week allows.
Ride Zone 2 on real roads, hills included
Real roads rarely let you hold a level effort. Climbs push it up, descents let you coast, and traffic breaks up even a steady ride.
Hills make this hard. A cyclist in Wellington, New Zealand, asked on r/cycling, “How can I do any easy or zone 2 ride with this situation?”
The hill was 4 km long, averaged 6%, and included short pitches around 15%. The rider had to climb it to get home.
A steep, unavoidable climb can push you above the zone even in an easy gear. Brief stretches above the target are part of an easy outdoor ride.
TrainerRoad examined more than 78,000 recorded outdoor rides of at least 90 minutes. In that sample, riders above 5 W/kg had a longest uninterrupted Zone 2 stretch of about nine minutes, against four minutes for riders below 2.5 W/kg.

Traffic lights, turns, and descents interrupt your pedaling for good reasons. Control and safety come before steady pedaling.
When steady aerobic work is the aim, pick a flatter, safer route, or use an indoor trainer if your local roads make that hard. Shift into an easier gear as a climb begins, and accept short harder sections when the road gives you no alternative.
When Zone 2 feels too easy or the watts look too low
A Zone 2 ride feels easy, and low watts are fine when they sit inside your own zone. At an FTP of 150, Zone 2 starts at 84 watts. Judge the ride by your intensity relative to your FTP and by its endurance purpose, since the watts alone don’t tell you whether it helps.
Why your legs can tire on an easy ride
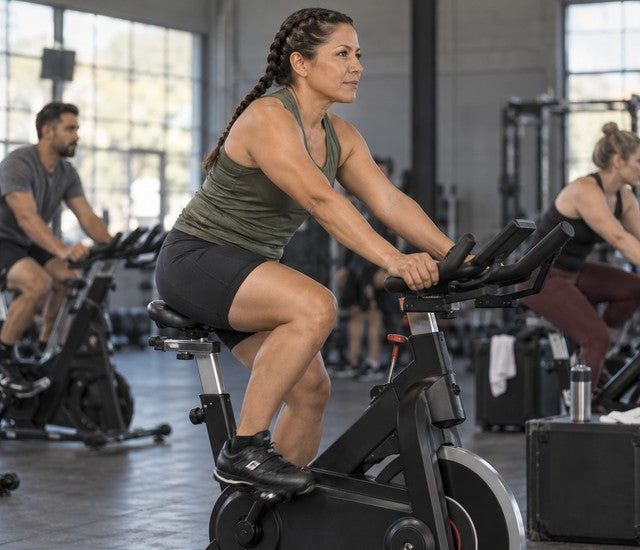
You can breathe comfortably and still finish a long ride with tired legs. Intensity describes the effort at one moment; muscular work adds up the longer you ride.
One cyclist preparing for a century ride reported this on r/cycling: “My question is after 2.5 hours my legs are destroyed while I still feel good in terms of heart and lungs.”
A ride that feels easy at the start can turn demanding once it runs longer than your recent riding has prepared you for.
Before you lengthen your next ride, compare it with the distances and durations you’ve completed recently. Leave time to recover between sessions, and plan for food and fluids on longer rides.

Severe or unusual symptoms and persistent pain are not ordinary fatigue. Stop riding and get a medical evaluation.
What to do when heart rate, power and effort disagree
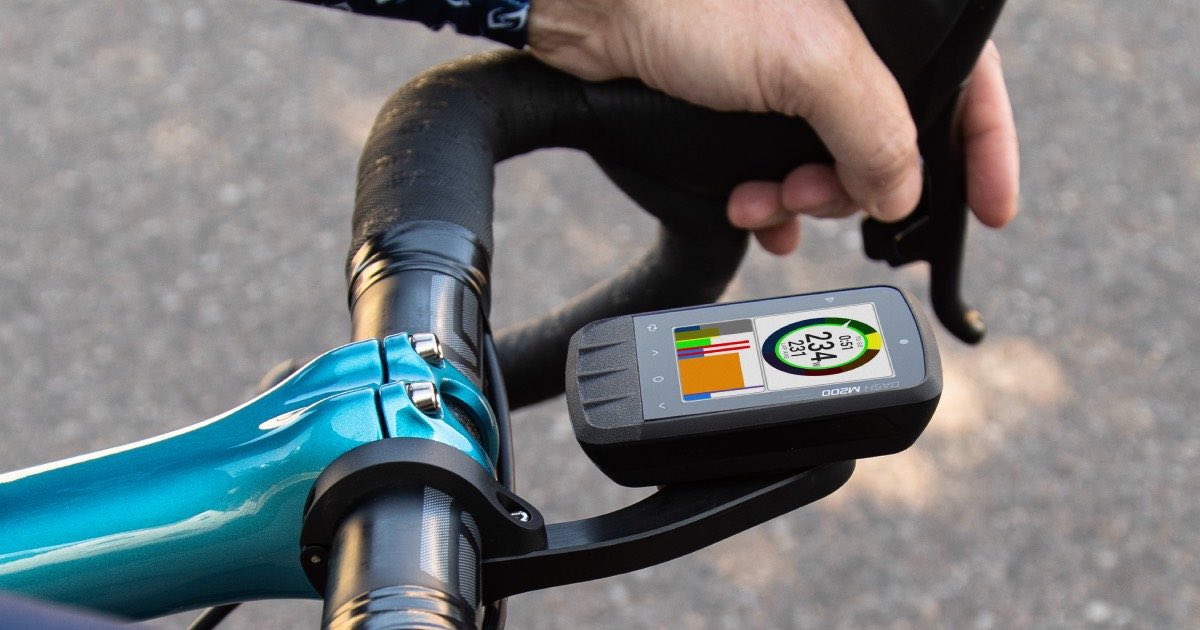
A watch can label your effort easy while your legs feel close to their limit. The display alone can’t tell you why.
A rider comparing cycling with running described the gap: at a pace that felt like Z2, their heart rate on the bike would likely be 110 to 120 bpm.
Heart-rate responses differ between sports. Muscular demands, training history, the effort you sustain, and the definition behind an HR zone all explain numbers that seem to contradict each other.
In prolonged exercise in the heat, heart rate can rise even when your output stays steady. A 2015 review of cardiovascular drift, the slow climb in heart rate as stroke volume (the blood pumped per beat) falls, describes the pattern under heat stress, with temperature and hydration among the influences.
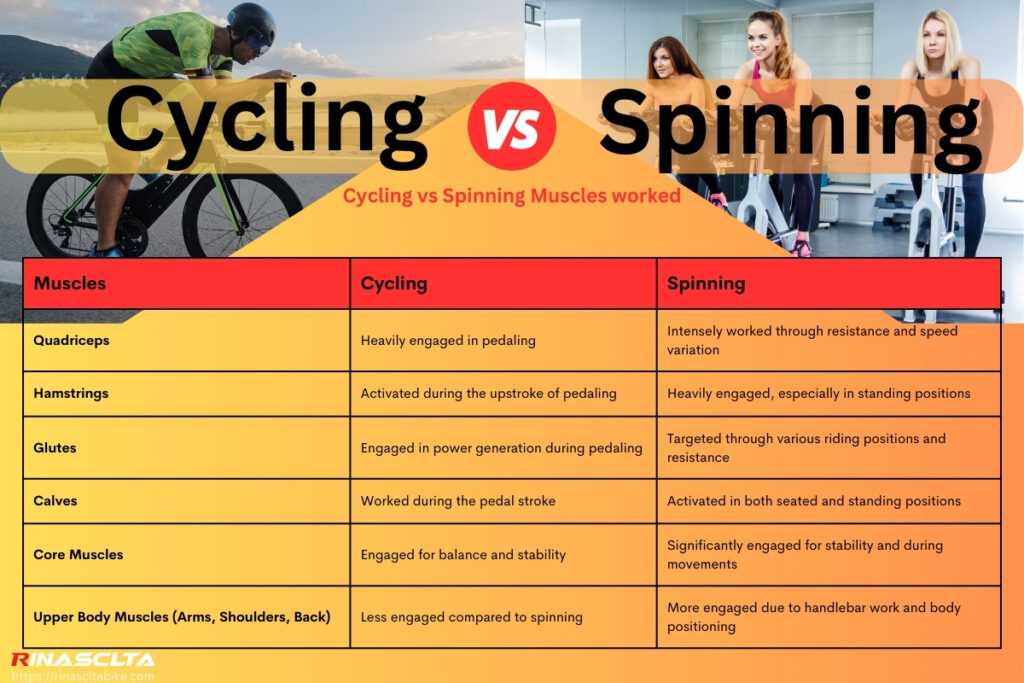
| What you observe | Likely explanation | Immediate response |
|---|---|---|
| Low displayed HR zone, near-maximal leg effort | Target and perceived demand disagree | Back off until the effort feels sustainable |
| Rising HR with relatively steady watts in heat | Cardiovascular drift | Factor in the weather and how strained you feel |
| Power and HR labels disagree | Metrics and zone models use different references | Check the reading against how sustainable the effort feels |
| A familiar output now feels unexpectedly hard | Duration, conditions, or fatigue changed your response | Ease off and check the ride conditions |
Do women need different Zone 2 numbers?
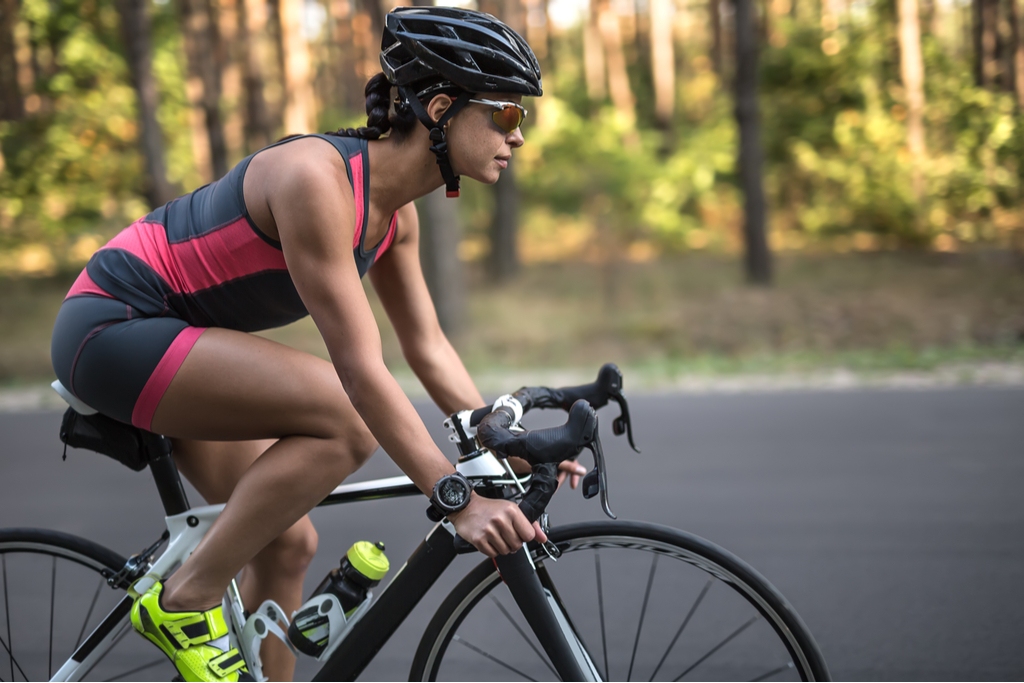
Women’s Zone 2 numbers come from the same two inputs as anyone’s: the zone method you choose and your own effort or threshold measurements.
In an incremental cycle-ergometer study published online in 2024, Benítez-Muñoz and colleagues tested 24 women and 20 men. The women in that sample had higher heart rates, including heart rate relative to maximum, at the first and second lactate thresholds. Those are group-level differences, so each woman’s Zone 2 target in bpm or percent of maximum HR still has to be set individually.
Female athletes were also underrepresented in the 2025 training-distribution analysis: 52 of its 348 participants were women.
Choose one easy endurance ride for the coming week and put it in your calendar.